
How Large Is the U.S. Healthcare Market? 2024 Size & 2034 Outlook
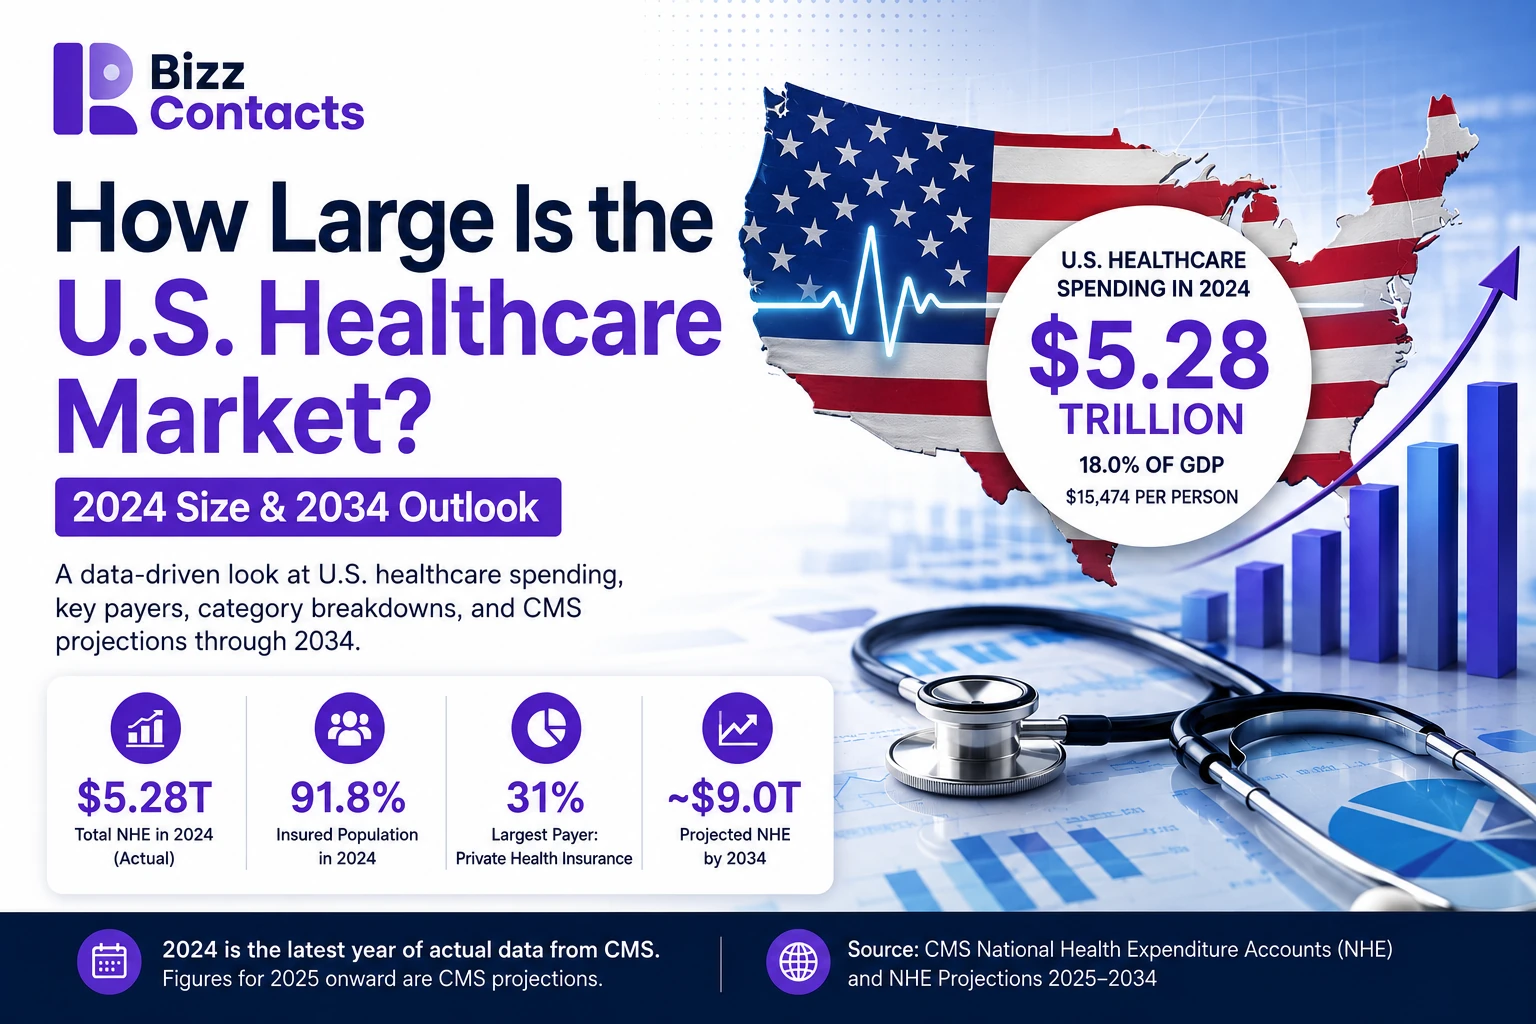
U.S. national health expenditures reached $5,278.6 billion in 2024, $15,474 per person and 18.0% of GDP. A sourced breakdown by service, by payer, and what CMS projects through 2034.

U.S. national health expenditures totalled $5,278.6 billion, or about $5.3 trillion, in 2024. That was $15,474 per person and 18.0% of gross domestic product, and it grew 7.2% over 2023. The source is the Centers for Medicare & Medicaid Services (CMS), which publishes the official estimates of U.S. health spending through its National Health Expenditure Accounts.
2024 is the most recent year with actual, measured data. CMS projects spending reached roughly $5.7 trillion in 2025 and grows another 6.3% in 2026, but those are projections from the CMS Office of the Actuary, not measurements, and this page labels them as such throughout.
One clarification before the numbers, because it causes most of the confusion around this topic: $5.3 trillion is health spending. It is not the revenue of the healthcare industry, and it is not healthcare's contribution to GDP. Those are three different measures with three different answers, explained below.
Key Takeaways
- $5.28 trillion: U.S. national health expenditures in 2024 (actual).
- $15,474: health spending per person in 2024 (actual).
- 18.0%: health spending as a share of U.S. GDP in 2024 (actual).
- $1.63 trillion: hospital care spending, the largest single category, 31% of the total.
- $1.11 trillion: physician and clinical services, 21% of the total.
- $1.64 trillion: private health insurance spending, the largest single source of funds, 31% of the total.
- 7.2%: annual growth in 2024, driven mainly by higher use of services rather than by prices.
- About $9 trillion: CMS-projected national health expenditures in 2034 (projected).
- 20.6%: CMS-projected health spending as a share of GDP in 2034 (projected).
Sources: CMS National Health Expenditure Accounts (2024 actuals) and CMS National Health Expenditure Projections 2025 to 2034.
On this page
- U.S. healthcare market size at a glance
- What “U.S. healthcare market size” means
- U.S. healthcare spending by category
- Where U.S. healthcare dollars go
- Who pays for healthcare in the U.S.
- U.S. healthcare spending over time
- Market outlook through 2034
- How U.S. spending compares with other countries
- Is healthcare the largest U.S. industry?
- What is driving healthcare spending
- What the market means for B2B companies
- How BizzContacts supports healthcare B2B segmentation
- Methodology and sources
- Frequently asked questions
U.S. Healthcare Market Size at a Glance
| Metric | Figure | Year | Status | Source |
|---|---|---|---|---|
| Total national health expenditures | $5,278.6 billion | 2024 | Actual | CMS NHEA |
| Health spending per person | $15,474 | 2024 | Actual | CMS NHEA |
| Health spending as a share of GDP | 18.0% | 2024 | Actual | CMS NHEA |
| Annual growth in national health expenditures | 7.2% | 2024 | Actual | CMS NHEA |
| Personal health care spending | $4,510.2 billion | 2024 | Actual | CMS NHEA |
| Share of the population with insurance | 91.8% | 2024 | Actual | CMS NHEA |
| Total national health expenditures | About $5.7 trillion | 2025 | Projected | CMS Office of the Actuary |
| Total national health expenditures | About $9.0 trillion | 2034 | Projected | CMS Office of the Actuary |
| Health spending as a share of GDP | 20.6% | 2034 | Projected | CMS Office of the Actuary |
What Does “U.S. Healthcare Market Size” Mean?
Ask four organisations how big the U.S. healthcare market is and you can get four different numbers, all defensible. The difference is almost always definitional rather than factual.
National health expenditures (NHE) is the measure used on this page. CMS builds it to capture total spending on health care goods, services and related activity in the United States, regardless of who pays. It covers hospital care, physician visits, drugs bought at retail, nursing homes, home health, dental work, insurance administration, public health activity, and investment in medical research, buildings and equipment.
CMS separates a few layers inside that total:
- Personal health care ($4,510.2 billion in 2024) is the goods and services delivered to patients. It is NHE minus insurance administration, public health activity and investment.
- Health consumption expenditures ($5,039.9 billion in 2024) is NHE minus investment. This is the layer that lines up with international comparisons, which matters later on this page.
- Investment ($238.7 billion in 2024) is medical research ($70.4 billion) plus structures and equipment ($168.2 billion).
Three other definitions turn up regularly:
- Industry revenue. A report measuring what healthcare organisations actually bill lands near the Bureau of Economic Analysis gross output figure for health care and social assistance, which was $3,588.2 billion in 2024. It is lower than NHE because NHE also counts drugs and devices made by manufacturers, insurance administration and construction.
- GDP contribution. Value added by the health care and social assistance industry was 7.5% of GDP in 2024 (BEA). Lower again, and for a different reason explained further down.
- Segment estimates. Commercial reports on the U.S. medical device market or the digital health market measure one slice, usually with their own product boundaries.
None of these are wrong. They answer different questions. Two rules keep the numbers honest: never add a commercial market estimate to a CMS figure, and never compare two figures without checking that both use the same definition.
U.S. Healthcare Spending by Category
Hospital care and physician and clinical services together accounted for about 52% of national health expenditures in 2024 (calculation by BizzContacts using CMS-published amounts). Note that physician and clinical services is broader than physician practices: CMS includes freestanding clinics and laboratories in the same category.
| Category | 2024 spending | Growth vs 2023 | Share of NHE | What it covers |
|---|---|---|---|---|
| Hospital care | $1,634.7B | +8.9% | 31% | Inpatient and outpatient services billed by hospitals |
| Physician and clinical services | $1,109.7B | +8.1% | 21% | Physician offices plus freestanding clinics and laboratories |
| Retail prescription drugs | $467.0B | +7.9% | 9% | Drugs bought at retail pharmacies, not those administered in hospitals |
| Other health, residential and personal care | $320.5B | +9.1% | 6% | Care in non-traditional settings, ambulance, residential behavioural health |
| Nursing care facilities and continuing care retirement communities | $219.9B | +7.3% | 4% | Freestanding nursing facilities and CCRCs |
| Dental services | $189.2B | +6.6% | 4% | Dental practices |
| Other professional services | $184.9B | +10.8% | 4% | Physical therapy, optometry, podiatry, chiropractic, mental health practitioners |
| Home health care | $169.4B | +10.2% | 3% | Freestanding home health agencies |
| Other non-durable medical products | $128.7B | +4.4% | 2% | Over-the-counter medicines, medical instruments, surgical dressings |
| Durable medical equipment | $86.4B | +5.4% | 2% | Eyeglasses, contact lenses, hearing aids, oxygen, equipment rental |
| Government administration | $66.1B | 1% | Administering public health insurance programmes | |
| Net cost of health insurance | $306.0B | 6% | Insurer administration, taxes and profit, above claims paid | |
| Government public health activities | $157.6B | −0.3% | 3% | Federal, state and local public health programmes |
| Investment | $238.7B | +2.2% | 5% | Research ($70.4B) plus structures and equipment ($168.2B) |
Three things in that table are easy to misread.
Retail prescription drugs look small at $467.0 billion, or 9% of the total. The category counts only drugs bought at retail pharmacies. Medicines given in hospitals and physician offices sit inside those categories instead, so the full cost of medicines to the system is higher than the retail line suggests.
The fastest-growing categories are not the biggest ones. Other professional services grew 10.8% and home health care grew 10.2% in 2024, both faster than hospital care.
Prices did very little of the work. CMS reports hospital prices rose 3.4% in 2024, the fastest since 2007, while physician and clinical services prices rose 1.8% and retail prescription drug prices rose 1.4%. Against category growth of 8% to 9%, that leaves use and intensity of services doing most of the lifting.
B2B Takeaway
The gap between category size and category growth is what matters commercially. Hospital care is where the money is. Home health, other professional services and residential behavioural care are where the growth rate is. Those are very different buying organisations, with different budgets and different decision cycles.
Where Do U.S. Healthcare Dollars Go?
A second way to read the same data is by layer rather than by category. Of every $100 of U.S. health spending in 2024:
- $85.44 was personal health care, meaning goods and services delivered to patients
- $5.80 was the net cost of health insurance, plus $1.25 for government administration of public programmes
- $2.99 was government public health activity
- $4.52 was investment in research, buildings and equipment
Calculation by BizzContacts using CMS-published data (NHE Tables 1 and 2, 2024). CMS publishes the dollar amounts; the per-$100 conversion is ours. This structure is stable year to year, so the movement worth watching happens inside the personal health care layer and in who pays for it.
Who Pays for Healthcare in the U.S.?
This question has two correct answers depending on the classification used, and mixing them up is the most common error in coverage of this topic. CMS reports health spending both by source of funds and by sponsor, and the two rank differently.
By source of funds
Private health insurance is the largest single source of funds, at $1,644.6 billion in 2024, or 31% of national health expenditures.
| Source of funds | 2024 spending | Growth vs 2023 | Share of NHE |
|---|---|---|---|
| Private health insurance | $1,644.6B | +8.8% | 31% |
| Medicare | $1,118.0B | +7.8% | 21% |
| Medicaid (federal and state combined) | $931.7B | +6.6% | 18% |
| Other third-party payers, programmes and public health activity | $590.5B | +7.0% | 11% |
| Out-of-pocket | $556.6B | +5.9% | 11% |
| Other health insurance programmes (CHIP, DoD, VA) | $198.6B | +3.3% | 4% |
| Investment | $238.7B | +2.2% | 5% |
By sponsor
Sponsor asks a different question: who ultimately finances the bill, through premiums, out-of-pocket payments or taxes. On that basis the federal government comes first.
| Sponsor | 2024 spending | Growth vs 2023 | Share of NHE |
|---|---|---|---|
| Federal government | $1.7 trillion | +5.5% | 31% |
| Households | $1.5 trillion | +6.9% | 28% |
| Private businesses | $967.4B | +5.6% | 18% |
| State and local government | $859.7B | +12.1% | 16% |
| Other private revenues | Not published separately | 6% |
Read together, no single group pays a majority. Government at all levels sponsors 47% of health spending, the 31% federal share plus the 16% state and local share (calculation by BizzContacts using CMS-published shares). Households sponsor 28%, well above the 11% they pay directly out of pocket, because households also fund Medicare premiums, payroll taxes and their share of employer plan premiums.
State and local government spending grew 12.1% in 2024, the fastest of any sponsor. CMS attributes this mainly to the state share of Medicaid, which rose 19.2% as the temporary enhanced federal match from the pandemic period phased out.
U.S. Healthcare Spending Over Time
| Year | Total NHE | Per person | Share of GDP | Annual growth | Status |
|---|---|---|---|---|---|
| 2019 | $3,805.1B | $11,487 | 17.7% | +4.6% | Actual |
| 2020 | $4,204.3B | $12,637 | 19.7% | +10.5% | Actual |
| 2021 | $4,376.9B | $13,137 | 18.4% | +4.1% | Actual |
| 2022 | $4,586.6B | $13,689 | 17.6% | +4.8% | Actual |
| 2023 | $4,925.3B | $14,580 | 17.7% | +7.4% | Actual |
| 2024 | $5,278.6B | $15,474 | 18.0% | +7.2% | Actual |
The 2020 jump is mostly arithmetic and emergency policy rather than a lasting shift in care. Health spending rose 10.5% while GDP fell 0.8%, which pushed the GDP share to 19.7%. Government public health activity spending rose 124.3% that year. By 2022 the share had fallen back to 17.6%, below where it started in 2019.
The 2023 and 2024 acceleration is different in kind. Growth of 7.4% and 7.2% came with broad increases in use of care and in coverage, not a one-off emergency response. Across the six years, spending per person rose from $11,487 to $15,474, an increase of 34.7% (calculation by BizzContacts using CMS Table 1).
U.S. Healthcare Market Outlook Through 2034
Everything in this section is projected by the CMS Office of the Actuary and was published in June 2026. Projections are not measurements, and CMS revises them as legislation and data change.
| Year | Total NHE | Status | Annual growth |
|---|---|---|---|
| 2024 | $5,278.6B | Actual | +7.2% |
| 2025 | About $5.7 trillion | Projected | +7.3% |
| 2026 | CMS does not publish a dollar level for this year in the cited forecast summary | Projected | +6.3% |
| 2027 to 2028 | Not published as a level | Projected | +4.9% average |
| 2029 to 2034 | Not published as a level | Projected | +5.2% average |
| 2034 | About $9.0 trillion | Projected | 20.6% of GDP |
Across 2025 to 2034, CMS projects health spending to grow 5.4% per year on average against GDP growth of 4.1%. That gap lifts health spending from 18.0% of GDP in 2024 to a projected 20.6% in 2034.
What shapes the path, according to CMS:
- 2025 stays elevated on continued strong use of services and goods. CMS projects Medicare reached about $1.2 trillion and Medicaid about $1.0 trillion, with private health insurance and hospital care each at about $1.8 trillion.
- 2026 slows to 6.3%, partly because enhanced Marketplace subsidies expire. CMS projects direct-purchase enrolment falls by 3.7 million.
- 2027 to 2028 slows to 4.9% per year, influenced by declining Medicaid enrolment following One Big Beautiful Bill Act community engagement requirements. The insured share of the population is projected to fall to 90.4% in 2028.
- 2029 to 2034 returns to 5.2% per year, driven by demographics as the last baby boomers enrol in Medicare.
By payer, CMS projects Medicare grows fastest among the major sources of funding at 7.7% per year on average over 2025 to 2034, with Medicaid and private health insurance both at 5.0%. By category, retail prescription drugs lead at 5.7% per year, ahead of physician and clinical services at 5.5% and hospital care at 5.2%. The federal government's sponsored share is projected to rise from 31% to 33%, and the insured share of the population to settle at 90.5% in 2034.
What This Means for Healthcare B2B
For a multi-year healthcare go-to-market plan, the composition shift matters more than the headline total. A decade in which Medicare grows at 7.7% and commercial insurance grows at 5.0% is a decade in which the buyer mix tilts toward organisations whose revenue is increasingly public. That affects procurement cycles, contracting and messaging.
U.S. Healthcare Spending Compared With Other Countries
International comparisons need a methodology note first, because the U.S. figure changes with the definition used.
OECD comparisons use current health expenditure under the System of Health Accounts framework, which excludes capital investment. The matching CMS line is health consumption expenditures, $5,039.9 billion in 2024, not the $5,278.6 billion NHE total. On that basis U.S. health spending was $14,775 per person and 17.2% of GDP in 2024. Both figures are reproducible from CMS data: $5,039.9 billion divided by a population of 341.1 million gives $14,775, and divided by GDP of $29,298 billion gives 17.2%.
| Measure (2024) | United States | Comparable-country average |
|---|---|---|
| Health spending per person | $14,775 | $7,860 |
| Health spending as a share of GDP | 17.2% | 11.2% |
The U.S. spends roughly twice as much per person as the average of these countries. Switzerland, the next-highest spender in the group, is still close to $5,000 per person below the United States. The U.S. also had the largest dollar increase in 2024, up $885 per person from 2023, ahead of Germany at $862 and the Netherlands at $822.
Is Healthcare the Largest U.S. Industry?
Healthcare is often called America's largest industry. Whether that holds depends entirely on the measure, and on two common measures it does not.
By employment: yes
Health care and social assistance employed 23.9 million workers in July 2026, more than any other industry sector, ahead of total government at 23.3 million and professional and business services at 22.5 million. The sector employed 22.9 million in December 2024. Source: BLS Current Employment Statistics, seasonally adjusted.
By projected job growth: yes
BLS projects health care and social assistance will have both the largest job growth and the fastest growth of any industry sector between 2024 and 2034, at 8.4%, against 3.1% for total employment. Source: BLS Employment Projections, released 28 August 2025.
By GDP contribution: no
Value added by health care and social assistance was 7.5% of GDP in 2024 and 7.7% in 2025. That ranks behind real estate and rental and leasing at 13.8%, government at 11.3%, manufacturing at 9.8%, professional, scientific and technical services at 8.0%, and finance and insurance at 7.6%. Source: BEA, value added by industry as a percentage of GDP.
By industry gross output: no
Gross output for health care and social assistance was $3,588.2 billion in 2024, behind manufacturing at $7,134.6 billion, real estate and rental and leasing at $5,881.0 billion, government at $5,427.5 billion, and finance and insurance at $4,157.3 billion. Source: BEA, gross output by industry.
So why is 18.0% of GDP quoted as though healthcare were the largest sector? Because it is a spending measure, not an output measure. NHE counts every dollar spent on health care regardless of which industry produced the good or service. A prescription drug counts as health spending, but the value created in making it is recorded under manufacturing. Insurance administration counts as health spending, but its value added is recorded under finance and insurance. Hospital construction counts in both health spending and construction's value added.
What Is Driving Healthcare Spending?
CMS attributes the 2023 and 2024 acceleration mainly to non-price factors, meaning more care used and a shift toward more intensive services. The supporting evidence in the CMS data:
- Use and intensity rather than prices. Hospital prices rose 3.4% in 2024 against 8.9% spending growth; physician and clinical services prices rose 1.8% against 8.1% spending growth.
- Coverage. Private health insurance enrolment rose from 207.0 million to 214.3 million in 2024, and Marketplace enrolment reached 21.1 million.
- Demographics. CMS cites the baby boomer cohort enrolling in Medicare through 2029, with the oldest reaching ages where use of care typically rises.
- Prescription drugs. CMS notes demand for diabetes and weight-loss drugs kept rising in 2024, partly offsetting an overall slowdown in retail prescription drug growth.
- Medicaid enrolment and acuity. Enrolment fell from 92.2 million to 84.3 million as states resumed eligibility redeterminations, while spending per enrollee rose 16.6%. CMS attributes that to the change in enrolment mix as younger and healthier enrollees left, plus rising provider rates and growth in state-directed payments through managed care.
There is no single cause, and CMS does not offer one. Treat any source that explains U.S. health spending growth with one factor as incomplete.
What the Market Means for B2B Companies
A $5.3 trillion system is not one market. It is a set of loosely connected markets with different budget owners, buying processes and growth rates. The CMS category data is effectively a map of where the budgets sit.
Hospital care at $1,634.7 billion and physician and clinical services at $1,109.7 billion are the two largest categories, and they behave nothing alike as buyers. Hospitals and health systems run committee-based procurement with long cycles, typically involving a CIO, CNO, CFO and supply chain leader. Physician practices are far more numerous, far smaller, and often decide in a single conversation.
The faster-growing categories are more fragmented still. Home health at $169.4 billion and other professional services at $184.9 billion, growing 10.2% and 10.8%, are made up of many small organisations. Reaching them is a coverage and segmentation problem more than a relationship problem.
That is why segmentation matters more in healthcare than in most verticals. A message written for a hospital CIO lands badly with a four-physician independent practice, and clinician contact data decays quickly as practitioners move between affiliations.
How BizzContacts Supports Healthcare B2B Segmentation
The practical version of the analysis above is being able to filter healthcare organisations by the attributes that change the pitch: organisation type, medical specialty, job title, facility type, EHR or EMR in use, geography and organisation size.
According to BizzContacts first-party figures published on our healthcare email list page, the database includes 9.5M+ healthcare contacts across 150+ medical specialties and 18,000+ hospitals and health systems, with 90+ filters, NPI validation, a 5-step verification process, weekly refresh and a stated 97% deliverability rate. These are BizzContacts figures, not CMS statistics, and are not verified by any government agency.
- Clinician targeting by specialty, for example physicians and nurses
- Facility targeting such as hospitals, and the executives who run them, including hospital CEOs and chief nursing officers
- Supplier-side targeting, for example medical device manufacturers
- Technology-based targeting through installed base data, including EHR platforms and specific systems such as Epic
Methodology and Sources
Primary sources
Spending figures come from the Centers for Medicare & Medicaid Services, Office of the Actuary, National Health Statistics Group. Specifically: the CMS NHE fact sheet, the CMS National Health Expenditures 2024 Highlights document, NHE historical Tables 1, 2 and 3, and the CMS National Health Expenditure Projections 2025 to 2034, published June 2026.
Industry output figures come from the Bureau of Economic Analysis value added and gross output by industry tables, published 25 June 2026. Employment figures come from Bureau of Labor Statistics Current Employment Statistics, seasonally adjusted, July 2026, and BLS Employment Projections 2024 to 2034, released 28 August 2025. The international comparison comes from the Peterson-KFF Health System Tracker, using OECD Health Statistics and CMS data, downloaded 21 January 2026.
Actual versus projected
2024 is the latest year of actual data. All 2019 to 2024 figures on this page are actual and labelled as such. Every 2025 and later figure is a CMS projection and labelled as projected. Where the CMS forecast summary does not publish a dollar level for a year, this page says so rather than estimating one.
Calculations by BizzContacts
Four figures on this page are calculated from CMS-published amounts rather than taken from a CMS table: the combined 52% share for hospital care and physician and clinical services; the per-$100 distribution of national health expenditures; the 34.7% increase in per-person spending from 2019 to 2024; and the 47% combined government sponsor share. Each is reproducible from CMS Tables 1, 2 and 3, and each is labelled in the text. No BizzContacts calculation is presented as an official CMS statistic.
Rounding and one source discrepancy
CMS calculates percent changes from unrounded data, so recomputing growth rates from the rounded dollar amounts here can differ slightly. Category shares are rounded to whole percentages and do not sum to exactly 100%. One discrepancy is worth stating: the CMS NHE fact sheet says other third-party payers and programmes and public health activity spending declined 7.0% in 2024 to $590.5 billion, while NHE Table 3 shows the category rising from $552.1 billion in 2023 to $590.5 billion in 2024, an increase of 7.0%. Both documents agree on the 2024 level and the 7.0% magnitude, and Table 3 carries the underlying series, so this page follows Table 3 and reports an increase.
Frequently Asked Questions
Calvin Christopher is the Marketing & Sales Manager at BizzContacts, specializing in B2B marketing, lead generation, sales intelligence, and verified business contact data.